

The Canterbury District’s Contribution to the WW1 Effort – an Introduction
The Canterbury District’s contribution to the WW1 effort was considerable when compared statistically across Australia. This was uncovered as a result of Dr Lesley Muir and her team of Canterbury & District Historical Society volunteers’ research.
The Team discovered:
- Over 1900 men and 4 women from the Canterbury District volunteered – way over the 608 listed on the missing honour roll. It represented around 11% of Canterbury’s citizens – the population when WWI began being 19,000 people.
- Their ages ranged from 14 to 51 years – the majority between 18 and 26 years of age.
- On the whole, the men were younger than the national average:
- 22% of them were under 20 years.
- 4% were under the eligible age of 18 years.
- The proportion of married men, at 28%, was significantly higher than the national average.
- 350 were killed and many came back disabled.
- Just over three-quarters enlisted before August 1916 – in fact, 14 men enlisted so early after war was declared on 4th August, that they sailed on 19th August 1914 with the Australian Naval and Military Expeditionary Force to take over the German Colonies of Rabaul and German New Guinea.
- Just under a quarter of the men served at Gallipoli.
- Many continued the fight against the Turks in Palestine and the Middle East.
- 19 joined the Australian Flying Corps.
- There were 3 doctors, 3 nurses and1 masseuse.
The Society also learned a lot about life in Canterbury during WWI. The young men who enlisted often joined up with their mates from school, the same street, same church or their club. In fact 9 out of 32 families in Lincoln Street, Campsie had sons at the Front, including the four Witheridge boys, three of whom did not return.
Detailed statistics
Just over 1,900 men and 5 women volunteered from Canterbury for service in World War I between 1914 and 1918. This represented 11% of the Municipality’s population at the outbreak of war, and about 36% of the eligible male population.
|
Year |
Population |
Houses |
Males 18-40 |
|
1911 |
11335 |
2329 |
2413 |
|
1914 |
16436 |
3382 |
3500 (estimate) |
|
1918 |
24378 |
5086 |
5192 (estimate) |
|
1921 |
37639 |
8225 |
8015 |
Over 96% of the men who enlisted joined the infantry, and the 4% of men who joined the Light Horse were chiefly from the land and from the racing stables around Canterbury racecourse.
The proportion of men who were married or widowed was 28%, significantly higher than the Australian average of 18%, calculated by L.L. Robson in his Australia-wide study of the First A.I.F. (Historical Studies v.15 no.61, p.737-49) They came mostly from the developed neighbourhoods of Canterbury (24% married), Campsie (26% married), Belmore (31% married) and Lakemba (42% married). The many railwaymen of Belmore and Lakemba, for instance, who enlisted at the end of 1916 in the special railway draft of fitters, firemen and locomotive drivers, were mostly older men who already had established families.
Canterbury’s volunteers contained a significantly younger cohort than the national averages calculated by Robson. 22% were under 20, whereas Robson’s Australia-wide study showed that overall there were 14% in this age group. 35% were aged between 20 and 24 (Robson: 44%), and 57% were under 25 (Robson; 52%). 4% of the volunteers were under age, the youngest group of ten boys enlisting at the age of just 15. The average age of Canterbury’s volunteers was 24.4. The average age of men enlisting in 1914 was 23.79, and the median was 23.
Just over 18% died while on active service.
Enlistment responses by significant periods identified by L.L. Robson (%)
|
Australia |
Canterbury |
|
|
August 1914 – June 1915 |
24% |
21% |
|
July 1915 – August 1916 |
50% |
55% |
|
Sept 1916 – End 1918 |
26% |
24% |
Enlistments by Calendar Year (%)
|
Australia |
Canterbury |
|
|
1914 |
12.6 |
9.7 |
|
1915 |
39.8 |
41.5 |
|
1916 |
29.9 |
34.8 |
|
1917 |
10.8 |
10.3 |
|
1918 |
6.9 |
3.7 |
Age at Enlistment, main enlistment period, July 1915 – August 1916 (Canterbury)
|
July 1915 |
3 |
11 |
34 |
15 |
12 |
4 |
2 |
81 |
|
Aug 1915 |
7 |
29 |
75 |
22 |
16 |
7 |
5 |
161 |
|
Sep 1915 |
4 |
11 |
40 |
18 |
7 |
3 |
5 |
88 |
|
Oct 1915 |
– |
7 |
17 |
5 |
6 |
1 |
4 |
40 |
|
Nov 1915 |
5 |
8 |
18 |
11 |
4 |
7 |
3 |
56 |
|
Dec 1915 |
3 |
7 |
13 |
9 |
3 |
1 |
1 |
37 |
|
Jan 1916 |
3 |
7 |
34 |
27 |
18 |
9 |
2 |
100 |
|
Feb 1916 |
– |
4 |
26 |
10 |
6 |
9 |
3 |
58 |
|
Mar 1916 |
5 |
10 |
26 |
13 |
5 |
7 |
5 |
71 |
|
Apr 1916 |
3 |
3 |
15 |
8 |
3 |
1 |
2 |
35 |
|
May 1916 |
1 |
6 |
15 |
9 |
9 |
5 |
2 |
47 |
|
June 1916 |
2 |
9 |
12 |
3 |
7 |
1 |
2 |
36 |
|
July 1916 |
2 |
3 |
4 |
6 |
2 |
1 |
2 |
20 |
|
Aug 1916 |
– |
6 |
9 |
4 |
2 |
2 |
– |
23 |
|
TOTAL |
38 |
121 |
338 |
160 |
100 |
58 |
38 |
853 |
|
Percentages |
4.4% |
14.1% |
39.6% |
18.7% |
11.7% |
6.8% |
4.4% |
|
|
Robson Percentages – |
13.2% |
36.5% |
22.3% |
11.2% |
8.1% |
8.7% |
||
Major Occupational Groups (%)
|
Australia |
Canterbury |
|
|
Professional |
4.8 |
1 |
|
Clerical |
5 |
9 |
|
Commerce |
12.3 |
10 |
|
Transport |
9.3 |
20 |
|
Tradesmen |
19.9 |
25 |
|
Labourers |
21.7 |
12 |
|
Primary/Farming |
17 |
8 |
|
Seafarers |
2 |
|
|
Miners |
3.7 |
1 |
|
Other |
4 |
6 |
|
Nurses |
0.3 |
Robson’s figures calculated from table 6 on p.748. “Industry” equated to “Tradesmen”, “Other” calculated by adding “Domestic” + “Other”.
The occupations of Canterbury’s volunteers are typical of those in a growing suburban area. The higher concentration of tradesmen reflects the high number of workers in the building trades – carpenters, builders, painters, electricians, plasterers – constructing the new suburbs.
The relatively low number of labourers and those engaged in farming and mining is also typical of a suburban area. There were still dairies and market gardens in the south and west of the municipality, but they were becoming fewer as farmers sold their allotments to speculative subdividers. Canterbury’s labourers were more likely to be building workers than farm labourers.
Most of the professional and clerical workers would have worked in the city of Sydney, commuting to work each day. A high proportion of those engaged in commerce were local shopkeepers.
The most striking feature of the occupation structure was the high number of transport workers who lived in the Canterbury area. These people included local carters and bus drivers, but the highest proportion were railway and tramway employees. From the 1890s to the 1960s, the suburbs in Canterbury District were “railway suburbs”, where the train and tram drivers, firemen, boilermakers, fitters, stationmasters and conductors lived.
Religious affiliations (%)
|
Australia |
Canterbury |
|
|
Anglican |
48.8 |
55.7 |
|
Presbyterian |
14.1 |
12 |
|
Methodist |
11.1 |
10 |
|
Other Protestant |
4.6 |
6.1 |
|
Catholic |
20.6 |
16 |
|
Jew |
0.4 |
|
|
Other |
0.4 |
0.2 |
Robson’s figures calculated from table 7.
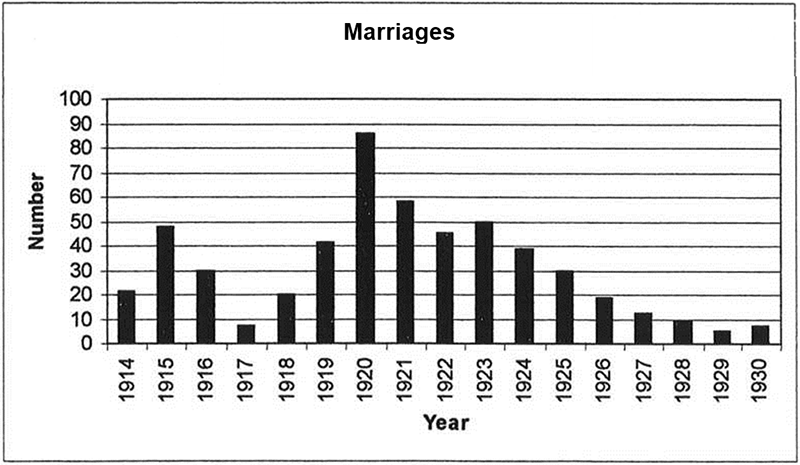
Marriage statistics
Data on year of marriage is available for 751 (40%) of those who enlisted from Canterbury. 221 were married before the outbreak of war, and, of these married men, only 17 enlisted in 1914. 74 enlisted in 1915, and 79 enlisted in 1916.
Of those single men who married during the war, many married just before their departure for overseas service. Half of the 48 who married in 1915 also joined the AIF in 1915; in 1916 the proportion that married immediately before leaving for overseas increased to 76%.
A very high proportion of the men married within one year of their return. Between 1917 and 1920, 158 of the unmarried men returned to Australia and 108, or 68%, were married within a year of their return. 1920 was the peak year for marriages of returned servicemen. Many of them married a sister of a local AIF soldier.
Source: Canterburys Boys: World War I & Sydney’s Surburban Fringe. Edited by Lesley Muir. Canterbury and District Historical Society, 2002.